---
slug: /configure-monitor
---
# Configure monitoring components
The performance monitoring and alerting features of obshell Dashboard depend on Prometheus and Alertmanager. This topic describes how to deploy the required monitoring components.
## Background
The performance monitoring feature of obshell Dashboard relies on obagent and Prometheus, while the alerting feature relies on Alertmanager. obagent provides an HTTP interface for data collection from seekdb. Prometheus periodically accesses obagent's interface to collect and persist monitoring data. obshell Dashboard displays the monitoring data collected by Prometheus. Alertmanager processes alerts from monitoring systems like Prometheus, offering features such as alert deduplication, grouping, routing, and muting.
## Install obagent
### Configure seekdb
1. Prepare a user
We recommend that you use a read-only user and grant the SELECT privilege on the oceanbase.* database to the user.
```shell
obclient> create user monitor identified by '******';
obclient> grant select on oceanbase.* to monitor;
```
2. Set the instance name
If you want to monitor multiple seekdb instances by using Prometheus, you must set different instance names for these instances. This way, you can better distinguish these instances.
```shell
obclient> alter system set `cluster` = 'obcluster';
```
:::tip
To set the instance name, you must add backticks (`) to the cluster parameter.
:::
### Configure obagent
1. Install obagent
Go to the [Open Source Image Library](https://mirrors.aliyun.com/oceanbase/community/stable/) and download the obagent installation package corresponding to the architecture of your environment. Then, run the following command to install obagent. We recommend that you install the latest version.
```shell
[root@test ~]# rpm -ivh obagent-*.rpm
```
By default, obagent is installed in the `/home/admin` directory.
2. Configure obagent
Run the following command to configure the account password for data collection and some necessary metadata information.
```shell
[root@test ~]# cd /home/admin/obagent
[root@test obagent]# bin/ob_agentctl config --update monagent.ob.monitor.user=monitor,monagent.ob.monitor.password=******,monagent.ob.cluster.name=obcluster,monagent.pipeline.ob.status=active,agent.http.basic.auth.metricAuthEnabled=false
```
The following table describes the command parameters.
* `monagent.ob.monitor.user`: specifies the account for data collection. The value is the read-only user created in seekdb. In this example, the value is `monitor`.
* `monagent.ob.monitor.password`: specifies the password for the account for data collection. The value is the password of the read-only user in seekdb.
* `monagent.ob.cluster.name`: specifies the instance name of the seekdb instance. After you connect to the instance, you can run the `SHOW PARAMETERS LIKE 'cluster';` command to query the instance name. The value in the `value` column is the instance name.
* `monagent.pipeline.ob.status`: specifies whether to collect metrics of seekdb. Set the value to `active` to enable the collection of metrics of seekdb.
* `agent.http.basic.auth.metricAuthEnabled`: specifies whether to enable basic authentication for the HTTP interface of obagent. Set the value to `false` to disable basic authentication for the HTTP interface of obagent.
The command output is as follows:
```shell
{"successful":true,"message":"success","error":""}
```
3. Start obagent
```shell
[root@test obagent]# bin/ob_agentctl start
```
The command output is as follows:
```shell
{"successful":true,"message":"ok","error":""}
```
### Verification
You can check whether obagent is started by viewing the process, or you can access the data query interface to verify whether you can obtain monitoring data.
* View the process.
```shell
[root@test obagent]# ps -ef | grep agent
```
The output is as follows:
```shell
root 27064 1 0 14:46 ? 00:00:00 /home/admin/obagent/bin/ob_agentd -c /home/admin/obagent/conf/agentd.yaml
root 27071 27064 0 14:46 ? 00:00:00 /home/admin/obagent/bin/ob_mgragent
root 27072 27064 0 14:46 ? 00:00:00 /home/admin/obagent/bin/ob_monagent
root 27116 26122 0 14:47 pts/0 00:00:00 grep --color=auto agent
```
* Access the data query interface.
```shell
[root@test obagent]# curl -L 'http://127.0.0.1:8088/metrics/ob/basic'
```
The output is as follows:
```shell
# HELP ob_active_session_num monitor collected message
# TYPE ob_active_session_num untyped
ob_active_session_num{app="OB",ob_cluster_id="0",ob_cluster_name="obcluster",ob_tenant_id="1",obzone="",svr_ip="127.0.0.1",svr_port="2882",tenant_name="sys"} 0 1762135926015
# HELP ob_all_session_num monitor collected message
# TYPE ob_all_session_num untyped
ob_all_session_num{app="OB",ob_cluster_id="0",ob_cluster_name="obcluster",ob_tenant_id="1",obzone="",svr_ip="127.0.0.1",svr_port="2882",tenant_name="sys"} 0 1762135926015
# HELP ob_plan_cache_access_total monitor collected message
# TYPE ob_plan_cache_access_total untyped
ob_plan_cache_access_total{app="OB",ob_cluster_id="0",ob_cluster_name="obcluster",ob_tenant_id="1",obzone="",svr_ip="127.0.0.1",svr_port="2882",tenant_name="sys"} 33229 1762135926015
# HELP ob_plan_cache_hit_total monitor collected message
# TYPE ob_plan_cache_hit_total untyped
ob_plan_cache_hit_total{app="OB",ob_cluster_id="0",ob_cluster_name="obcluster",ob_tenant_id="1",obzone="",svr_ip="127.0.0.1",svr_port="2882",tenant_name="sys"} 32051 1762135926015
# HELP ob_plan_cache_memory_bytes monitor collected message
# TYPE ob_plan_cache_memory_bytes untyped
ob_plan_cache_memory_bytes{app="OB",ob_cluster_id="0",ob_cluster_name="obcluster",ob_tenant_id="1",obzone="",svr_ip="127.0.0.1",svr_port="2882",tenant_name="sys"} 1.15905078e+08 1762135926015
# HELP ob_server_num monitor collected message
# TYPE ob_server_num untyped
ob_server_num{app="OB",ob_cluster_id="0",ob_cluster_name="obcluster",obzone="",server_ips="127.0.0.1",status="ACTIVE",svr_ip="127.0.0.1",svr_port="2882"} 1 1762135926015
# HELP ob_sysstat monitor collected message
# TYPE ob_sysstat untyped
ob_sysstat{app="OB",ob_cluster_id="0",ob_cluster_name="obcluster",ob_tenant_id="1",obzone="",stat_id="10000",svr_ip="127.0.0.1",svr_port="2882",tenant_name="sys"} 2673 1762135926015
ob_sysstat{app="OB",ob_cluster_id="0",ob_cluster_name="obcluster",ob_tenant_id="1",obzone="",stat_id="10001",svr_ip="127.0.0.1",svr_port="2882",tenant_name="sys"} 2.838626e+06 1762135926015
······# Subsequent outputs are omitted
```
## Configure Prometheus
For more information, visit the [Prometheus website](https://prometheus.io/) or [open source mirror](https://mirrors.aliyun.com/oceanbase/community/stable/). You can download and deploy the corresponding installation package of Prometheus based on the architecture of the environment in which you want to deploy Prometheus. Generally, one Prometheus instance is sufficient to monitor all seekdb instances. This section provides only a sample configuration. For more information, see [Prometheus documentation](https://prometheus.io/docs/prometheus/latest/getting_started/).
:::info
For more information about the Prometheus alerting rules provided by OceanBase, see the GitHub repository.
:::
```shell
global:
scrape_interval: 5s # Set the scrape interval to every 15 seconds. Default is every 1 minute.
evaluation_interval: 5s # Evaluate rules every 15 seconds. The default is every 1 minute.
# Alertmanager configuration, prometheus will push alerts to these addresses
alerting:
alertmanagers:
- static_configs:
- targets:
- localhost:9093
# Load rules once and periodically evaluate them according to the global 'evaluation_interval'.
rule_files:
- "prometheus_rules.yaml"
# - "second_rules.yml"
scrape_configs:
- job_name: "ob-basic"
metrics_path: "/metrics/ob/basic"
# Open the following configurations for Prometheus 3.x.
# fallback_scrape_protocol: PrometheusText0.0.4
static_configs:
- targets: ["127.0.0.1:8088"]
- job_name: "ob-extra"
metrics_path: "/metrics/ob/extra"
# prometheus 3.x needs to enable the following configuration.
# fallback_scrape_protocol: PrometheusText0.0.4
static_configs:
- targets: ["127.0.0.1:8088"]
- job_name: "ob-host"
metrics_path: "/metrics/node/host"
# Enable the following configuration for Prometheus 3.x:
# fallback_scrape_protocol: PrometheusText0.0.4
static_configs:
- targets: ["127.0.0.1:8088"]
```
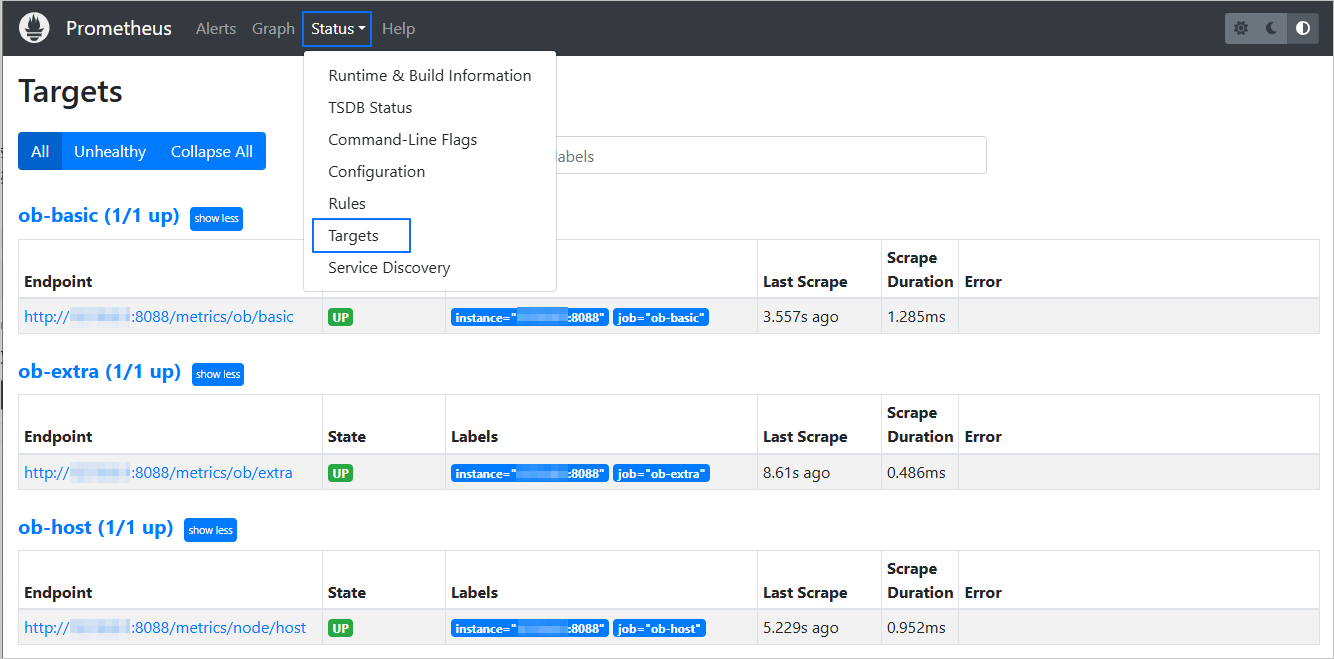
After you configure Prometheus, you can access the Prometheus graphical interface, click **Status** in the left navigation pane, and select **Target** to check whether data is collected.
:::info
Different versions of Prometheus may have different interface terms. Therefore, Target is provided as an example only in this case.
:::
### Configure Alertmanager
Go to [Prometheus](https://prometheus.io/) or [Open Source Mirror](https://mirrors.aliyun.com/oceanbase/community/stable/) and download and decompress the required installation package based on the architecture of your environment. Modify the configuration file (`alertmanager.yml`) as described in the [Alertmanager documentation](https://prometheus.io/docs/alerting/latest/configuration/). Then, go to the working directory and run the following command to start Alertmanager:
```shell
[root@test alertmanager]# nohup ./alertmanager --config.file=alertmanager.yml --cluster.advertise-address=127.0.0.1:9093 > alertmanager.log 2>&1 &
```
In the example, `127.0.0.1:9093` indicates the service address, and `nohup` indicates that the alertmanager process is run in the background.